
| Version 6 (modified by jazz, 15 years ago) (diff) |
|---|
2011-05-04
Bioinformatics
- Velvet 安裝紀錄(2009-11-11)
- 測試 Velvet 1.1.03 (支援 OpenMP)
- 系統:Debian Squeeze
~$ sudo apt-get update; sudo apt-get upgrade; sudo apt-get dist-upgrade
~$ sudo apt-get install build-essential
~$ wget http://www.ebi.ac.uk/~zerbino/velvet/velvet_1.1.03.tgz
~$ tar zxvf velvet_1.1.03.tgz
~$ cd velvet_1.1.03
~/velvet_1.1.03$ make
~/velvet_1.1.03$ ./velveth output 17 -fasta -short data/test_long.fa
~/velvet_1.1.03$ ./velvetg output/ -exp_cov 3 -min_contig_lgth 100
- 使用 valgrind 來進行記憶體分析 - (1) Memory Leak 分析
~/velvet_1.1.03$ sudo apt-get install valgrind
~/velvet_1.1.03$ valgrind -v --leak-check=full --show-reachable=yes --read-var-info=yes ./velveth output 17 -fasta -short data/test_long.fa 2> velveth.log
~/velvet_1.1.03$ valgrind -v --leak-check=full --show-reachable=yes --read-var-info=yes ./velvetg output/ -exp_cov 3 -min_contig_lgth 100 2> velvetg.log
- 使用 valgrind 的 Massif 工具來進行記憶體分析 - (2) Memory Usage 分析
- Valgrind's skin Massif ('valgrind --tool=massif application') traces memory usage of the application.參考#1
~/velvet_1.1.03$ valgrind --tool=massif ./velveth output 17 -fasta -short data/test_long.fa
~/velvet_1.1.03$ ms_print massif.out.10571
~/velvet_1.1.03$ valgrind --tool=massif ./velvetg output/ -exp_cov 3 -min_contig_lgth 100
~/velvet_1.1.03$ ms_print massif.out.10561
-------------------------------------------------------------------------------- Command: ./velveth output 17 -fasta -short data/test_long.fa Massif arguments: (none) ms_print arguments: massif.out.10571 -------------------------------------------------------------------------------- MB 66.60^ @@@@@@@@@@# | :@:::::::::@:::::::::::::::::::::::::::::::::::::::::@ # | :@:::: ::::@ : : : @ # | :@:::: ::::@ : : : @ # | :@:::: ::::@ : : : @ # | :@:::: ::::@ : : : @ # | :@:::: ::::@ : : : @ # | :@:::: ::::@ : : : @ # | :@:::: ::::@ : : : @ # | :@:::: ::::@ : : : @ # | :@:::: ::::@ : : : @ # | :@:::: ::::@ : : : @ # | :@:::: ::::@ : : : @ # | :@:::: ::::@ : : : @ # | :@:::: ::::@ : : : @ # | :@:::: ::::@ : : : @ # | :@:::: ::::@ : : : @ # | :@:::: ::::@ : : : @ # | :@:::: ::::@ : : : @ # | :@:::: ::::@ : : : @ # 0 +----------------------------------------------------------------------->Mi 0 120.8 Number of snapshots: 71 Detailed snapshots: [2, 4, 57, 67, 68 (peak)] -------------------------------------------------------------------------------- n time(i) total(B) useful-heap(B) extra-heap(B) stacks(B) -------------------------------------------------------------------------------- 0 0 0 0 0 0 1 201,656 34,224 34,099 125 0 2 14,964,257 33,864 33,747 117 0 - 使用 gprof 進行 profile 分析
~/velvet_1.1.03$ cat Makefile | sed "s#^CFLAG.*#CFLAGS = -Wall -pg#" >
~/velvet_1.1.03$ mv Makefile.new Makefile
~/velvet_1.1.03$ make
~/velvet_1.1.03$ ./velveth output 17 -fasta -short data/test_long.fa
~/velvet_1.1.03$ du -sh gmon.out
56K	gmon.out
~/velvet_1.1.03$ ./velvetg output/ -exp_cov 3 -min_contig_lgth 100
~/velvet_1.1.03$ du -sh gmon.out
152K	gmon.out
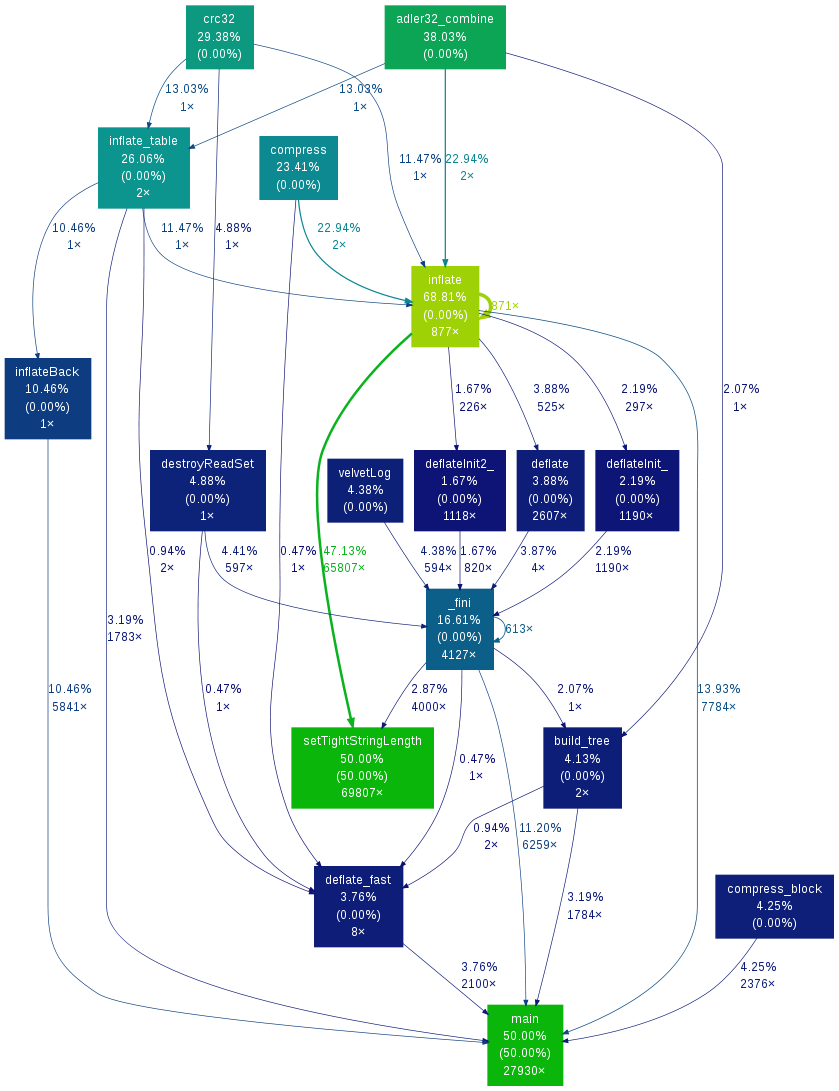
- 使用 gprof2dot 把 gprof log 轉成 graphviz 的 dot 格式,就可以畫出圖形了。
~/velvet_1.1.03$ sudo apt-get install graphviz python
~/velvet_1.1.03$ wget http://gprof2dot.jrfonseca.googlecode.com/hg/gprof2dot.py
~/velvet_1.1.03$ chmod a+x gprof2dot.py
~/velvet_1.1.03$ gprof velveth | ./gprof2dot.py | dot -Tpng -o velveth.png
~/velvet_1.1.03$ gprof velvetg | ./gprof2dot.py | dot -Tpng -o velvetg.png


Attachments (10)
- velveth.png (164.6 KB) - added by jazz 15 years ago.
- velvetg.png (74.3 KB) - added by jazz 15 years ago.
- massif.out.10571 (13.0 KB) - added by jazz 15 years ago.
- massif.out.10561 (31.9 KB) - added by jazz 15 years ago.
- velveth_massif.log (13.9 KB) - added by jazz 15 years ago.
- velvetg_massif.log (36.8 KB) - added by jazz 15 years ago.
- velveth.log (25.1 KB) - added by jazz 15 years ago.
- velvetg.log (114.8 KB) - added by jazz 15 years ago.
- velveth_callgrind.log (5.5 KB) - added by jazz 15 years ago.
- velvetg_callgrind.log (9.1 KB) - added by jazz 15 years ago.
Download all attachments as: .zip