
2011-03-31
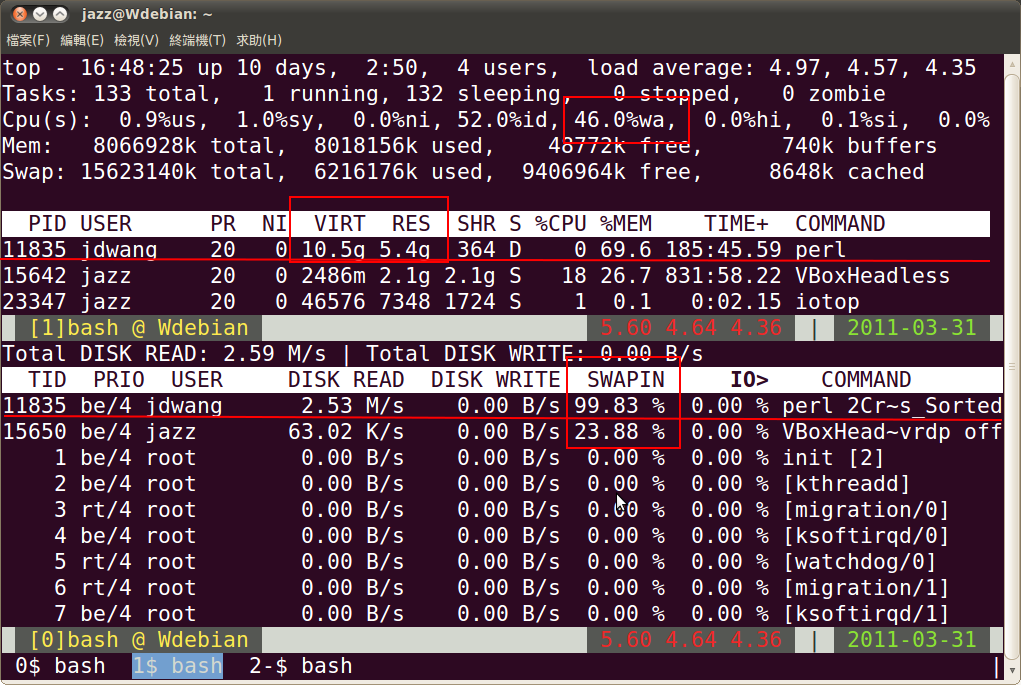
IOWait


callgraph
- C/C++
- Rex 在 CallGraphviz – call graph visualzer based on csope, graphviz and xdot 一文中介紹了許多不同的 callgraph 產生方式。
- 搭配維基百科 Call_graph的軟體簡介,大概整理如下:
- CodeViz - 缺點:必須 patch GCC 然後用 Perl 來產生圖形
- ncc - 目標是取代 cflow 跟 cscope,jserv 有介紹過 - 缺點:相依 GCC 環境版本
- cflow - 老字號 GNU 的流程分析工具 - Fred 有寫過用在分析 Android Dalvik VM 的示範 - 產生文字輸出
- cscope/global - Interactively examine a C program source - 我想 cscope 要強調的是 interactive 互動式除錯,而且照 Rex 的講法,可以只針對某個函數當進入點,而不是整個程式原始碼。
- 有 Debian 套件 cscope 跟 global
- CCTree - C Call-Tree Explorer - Cscope based source-code browser, code flow analysis tool - 給 VIM 用的 cscope plugin
- seascope - A pyQt GUI front-end for cscope - pyQt 寫的 cscope 圖形介面
- kscope - A source-code browsing, analysis and editing environment for large C projects. - KDE 版本的 cscope 圖形介面 - 有 Debian 套件 kscope
- KCachegrind - Profiling Visualization - 這個工具是搭配 Valgrind 這個 Profiler 可以在 runtime 產生 callgrah
- Gprof2Dot - 也是透過 profiler 產生的輸出來作視覺化動作,最初是支援 gprof 現在已經支援更多不同 profiler 了。
- egypt - 用 Perl 寫的
- Python
- pycallgraph - Python Call Graph
- Bash
- 我一直想找的是 Bash 的遞迴式 callgraph 產生器,雖然 Bash 可以加入 -X 參數來做 runtime 除錯,不過還沒有找到可以查出多層該怎麼追。
- bashdb - BASH Debugger - 可以用類似 GDB 的指令來 DEBUG Bash
- shprof - a line profiler for shell scripts
- 這邊有一招是蠻好玩的,居然只要設定 PS4 環境變數就可以秀出每個呼叫的開始時間。(這算是 bash 的簡易版 profiler 嘛?) <參考討論> time profiling a linux command or script
Least invasive you may want to play with some variant of...

set -x
PS4='$( date ): '
sleep 1
sleep 3
sleep 2
exit 0

which produces timestamps in front of the commands...

Mon Mar 17 02:39:35 CET 2008: PS4='$( date ): '
Mon Mar 17 02:39:35 CET 2008: sleep 1
Mon Mar 17 02:39:36 CET 2008: sleep 3
Mon Mar 17 02:39:39 CET 2008: sleep 2
Mon Mar 17 02:39:41 CET 2008: exit 0
Last modified 15 years ago
Last modified on Apr 22, 2011, 2:34:00 PM
Attachments (3)
- shprof (1.3 KB) - added by jazz 15 years ago.
- munin-status.png (137.6 KB) - added by jazz 15 years ago.
- top_vs_iotop.png (185.6 KB) - added by jazz 15 years ago.
Download all attachments as: .zip